
DebugView is a handy tool in GA4 that lets you see your event data in real time. Here’s how to turn it on:
1. Use the GA Debugger Chrome Extension
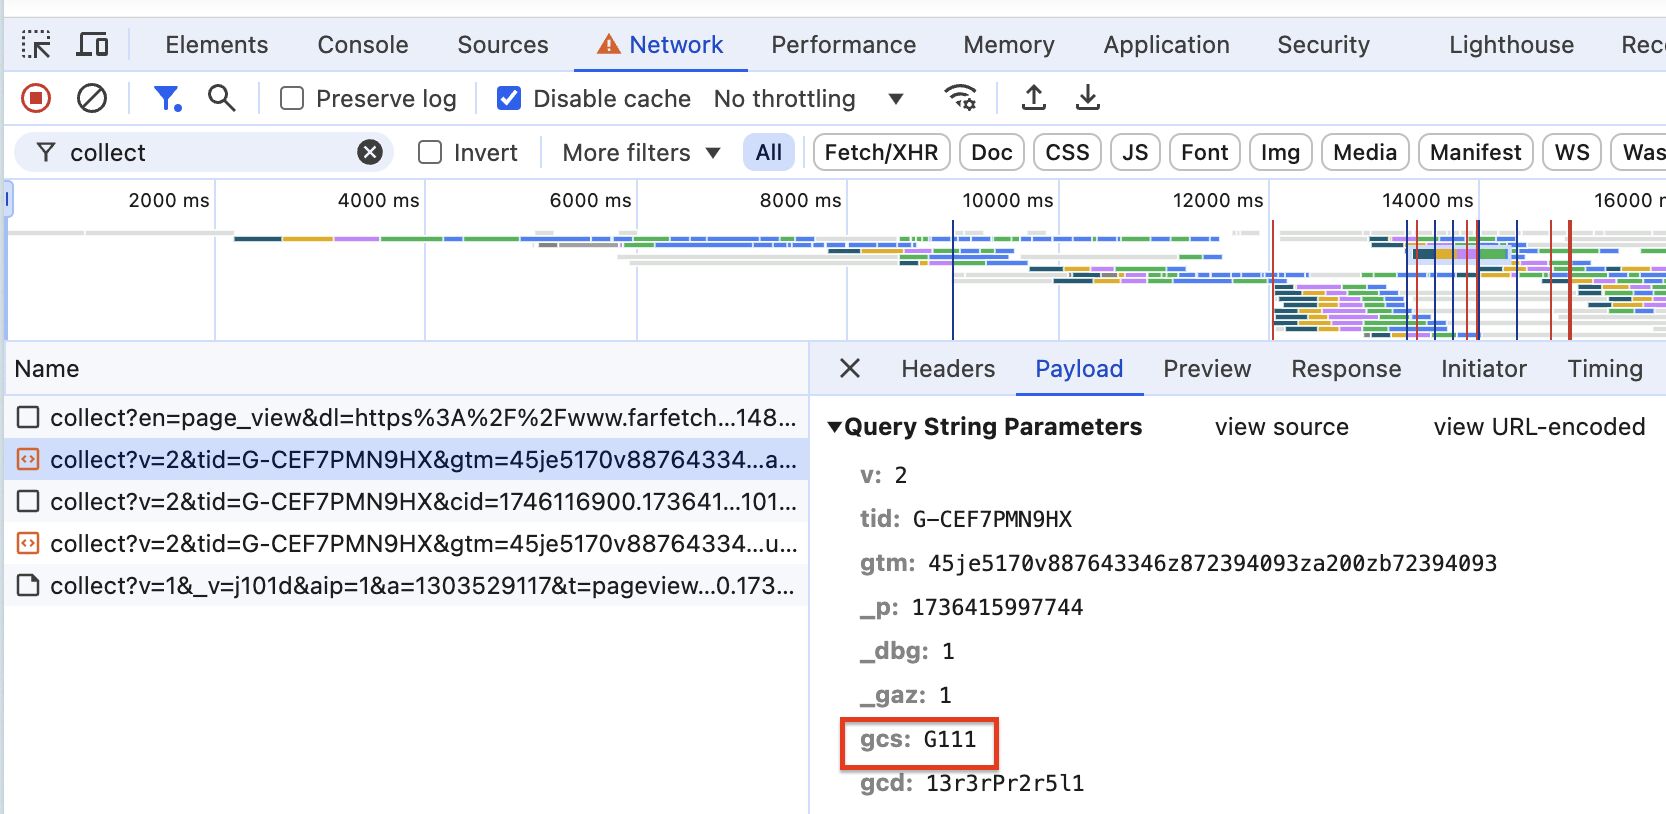
This is the easiest option! Just install the GA Debugger extension for Chrome, click its icon, and make sure it’s switched to “ON.” Now, interact with your website, and your events will start showing up in DebugView. The extension adds a special _dbg parameter to your GA4 requests, making them visible in DebugView automatically.
2. Turn on GTM Preview Mode
If you’re using Google Tag Manager (GTM), just enable Preview mode. That’s it! While you’re in GTM’s Preview mode, it adds the necessary parameters to show your events in DebugView without any extra effort on your part.
3. Add the debug_mode Parameter
Want to skip the extension or GTM Preview mode? No problem. You can add a debug_mode parameter to your events. Here’s how:
• In GTM: Add debug_mode with the value true to your GA4 configuration tag. This will apply to all events using that tag.
• For specific events: Add debug_mode only in certain event tags to debug them individually.
If you’re using hardcoded gtag.js, you can add the debug_mode parameter directly to your script.
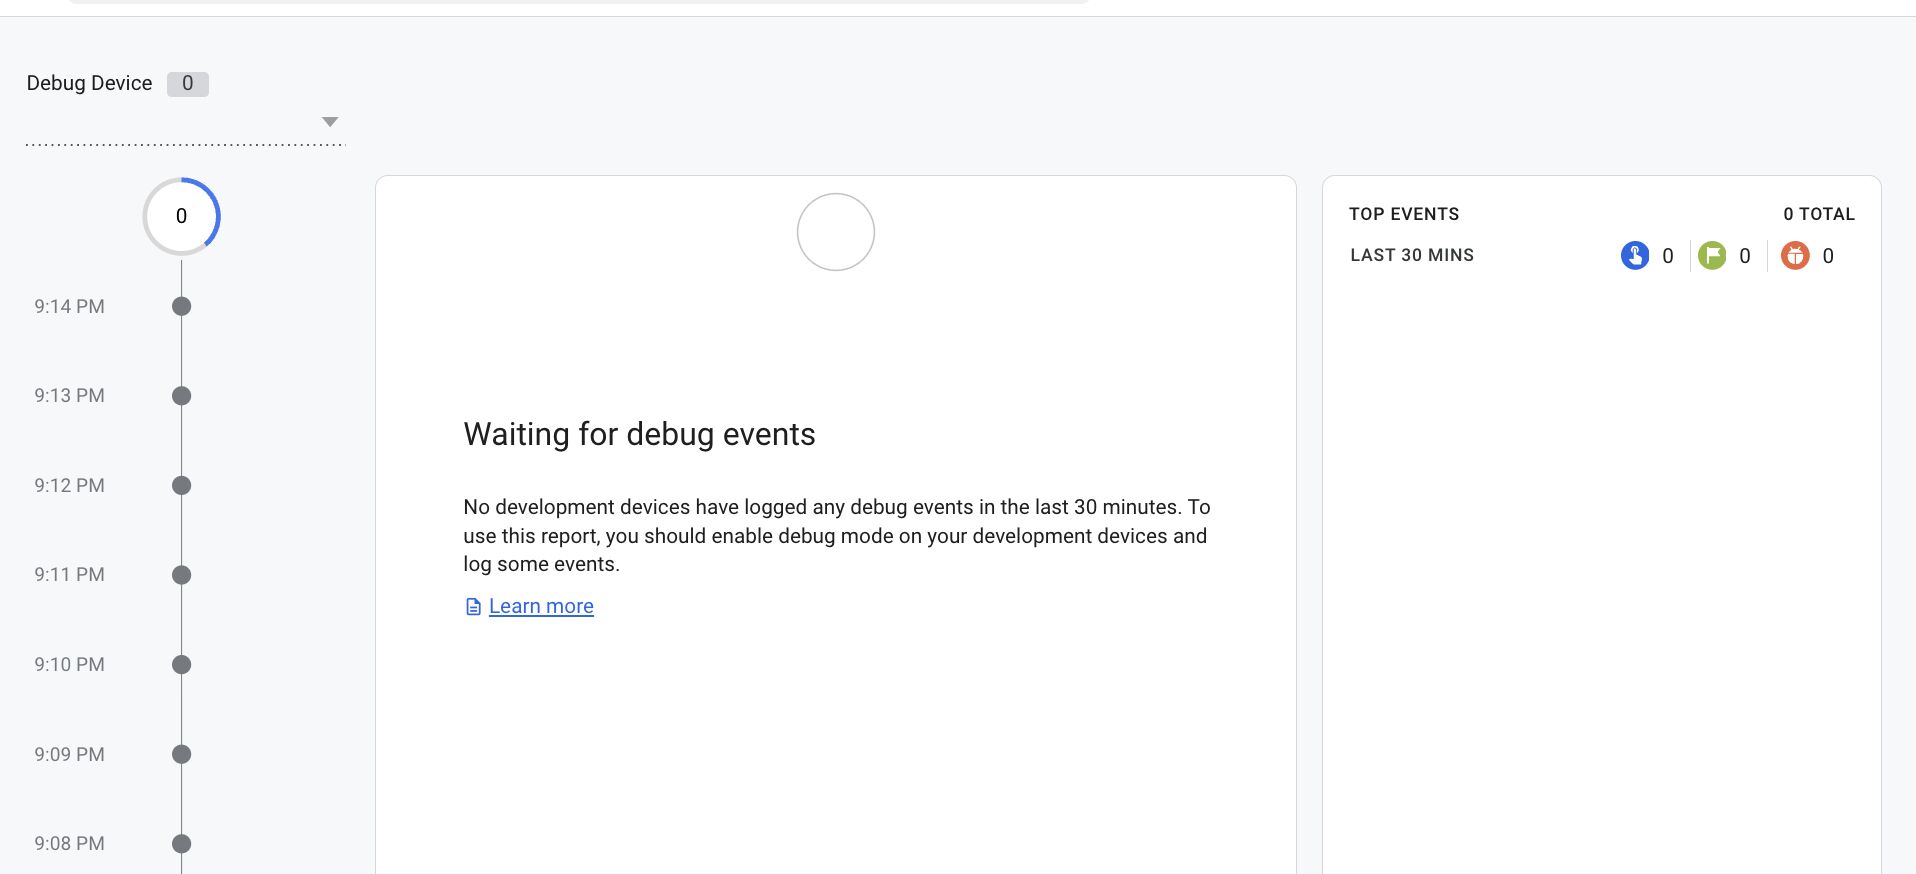
Once you’ve set up DebugView using any of these methods, head over to GA4 > Admin > DebugView and start monitoring your events in real time. Got questions or tips about DebugView? Share them in the comments! Let’s troubleshoot smarter, not harder.
Want all my posts in one place? I put 350+ articles on GA4, BigQuery, attribution, and metrics into one searchable library.
Go here to explore it for FREE.