While the Measurement Protocol for Google Analytics 4 (GA4) is still a work in progress, it can already be utilized to enhance the data collection process. Today, let's explore how to debug the data sent through this protocol to improve the quality and accuracy of the information gathered on your website.
Debugging in DebugView
One common challenge faced by many developers and analysts is the absence of data from the Measurement Protocol in GA4's DebugView. This can significantly complicate the debugging process and verification of the correctness of the transmitted data.
Problem Resolution
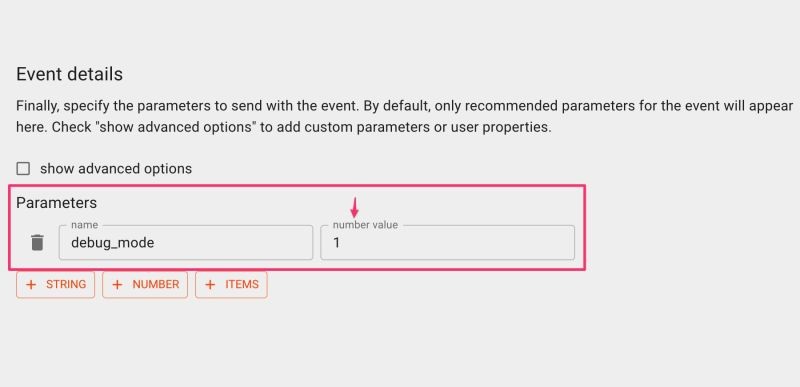
To make the Measurement Protocol data visible in DebugView, it's necessary to add a debug_mode parameter with a value of 1 to each event. This action activates the debug mode, allowing you to see the hits sent in DebugView. It's crucial to remember that for successful data display, the client identifier (client_id) or user identifier (user_id) must be registered in GA4 beforehand.
Important Aspects
1. If you are using a randomly generated client identifier, the data will not appear in DebugView. Ensure you use an identifier for which data has already been collected.
2. debug_mode parameter : adding this one to each event is mandatory. Only data sent with this parameter will be visible in debug mode.
Debugging Measurement Protocol data in GA4 may seem like a daunting task, but with the right approach, it becomes a manageable mission. The use of the debug_mode parameter is a key element in ensuring the visibility of this data in DebugView. It's a simple yet effective way to enhance the debugging and analytics quality on your website.
The picture is from Simo Ahava blog.
If you work with GA4 to BigQuery exports, be sure to check out my SQL cheat sheet.


