Average ROAS. Revenue divided by spend. The metric that fits perfectly on a slide and makes everyone nod in agreement.
I reported it for years. It always felt like the responsible thing to do.
Here's the problem: average ROAS throws new users, returning users, impulse buyers, and loyal customers into one blender and calls the smoothie "performance."
A campaign pulling in tourists who buy once and vanish can show the same ROAS as one bringing in people who stick around for months. At least until someone asks uncomfortable questions around day 60.
So what happens?
- You scale the campaign that looks brilliant today but quietly bleeds money by next quarter
- You cut the one that seems expensive but actually retains
- Everyone optimizes on the wrong signal and writes "data-driven" in their LinkedIn bio
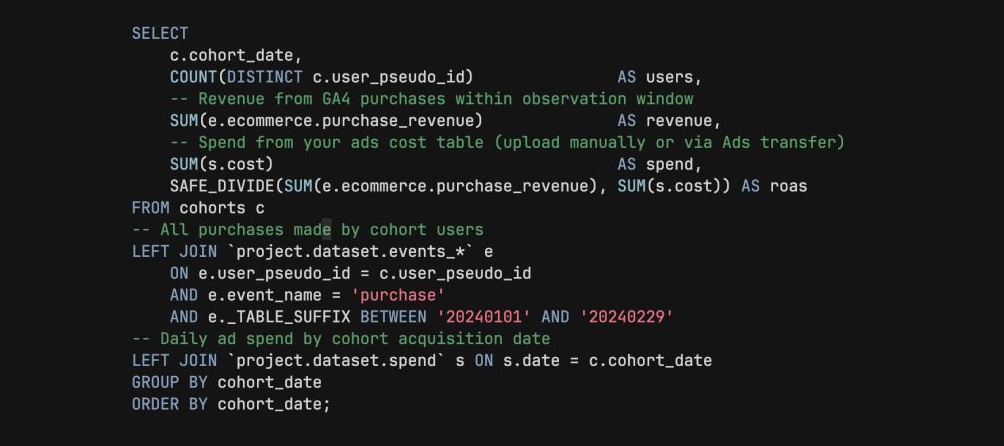
The fix isn't exotic. In BigQuery, group users by acquisition cohort - the week or month they first converted. Calculate cumulative revenue at day 30, 60, 90 per cohort. Compare to the spend that acquired them.
Now instead of one number that makes you feel good, you have a curve that tells you the truth.
I've seen cohort ROAS completely reverse budget priorities. The campaign everyone wanted to scale had a 3x ROAS on day 7 and a 0.8x by day 60. The quiet one nobody championed? It kept growing.
Same data. Different question. Very different budget decision.
Want all my posts in one place? I put 350+ articles on GA4, BigQuery, attribution, and metrics into one searchable library.
Go here to explore it for FREE.

